Earnings season is upon us.
Investors want to see the impact of rising input costs and supply chain constraints on companies sales and margins. The reports come at a critical moment for markets as indices sit on key support levels.
Banks dominate the early part of earnings season. When your business is your balance sheet you tend to have results ready to go at the drop of a hat. The institutions provide us keen insight into the cash flow of the economy. Reads into lending and consumer behavior allow us to extrapolate the performance to other sectors of the economy.
Banks do great in a rising rate environment as they are more profitable when they lend at a higher rate. One would think that the recent parabolic rally in rates bodes well for the group. However, institutions need a wide “spread” between the short end of the curve and the long end of the curve.
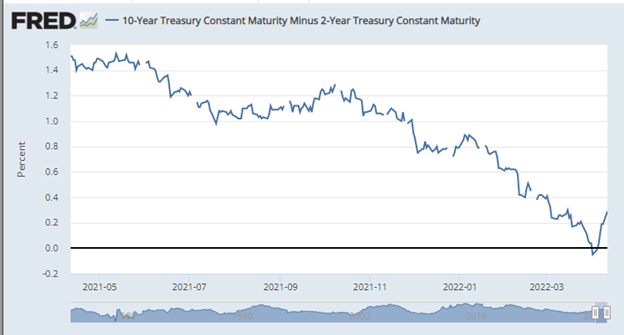
Banks lend at longer durations (i.e.- a 30-year mortgage, a 5-year car loan) and borrow at short duration (i.e.- 30-day, 90-day Treasury bills) to run day-to-day operations. The difference between those two levels is what is called the spread. That is the profit margin of traditional banking.
The 2-10 year spread, one of the most popular measures, has fallen from 1.59 in March 2021 to 0.19 on April 11. It briefly inverted on April 1. This has raised some concern that banks will not be as profitable in Q1 and 2022 in general. Net Interest Margin (NIM) measures the net interest income a financial firm generates from its credit products. This will be a key metric for investors to watch.
Banks operated in a volatile environment in the quarter. Russia invaded Ukraine, setting off a slew of sanctions from the West that disrupted banking systems. China, the world’s second biggest economy, implemented a ‘zero tolerance’ policy to combat covid which crippled supply chains.
Corporate clients will understandably be cautious in such an environment. This may lead to a decline in activity such as debt issuance, stock offerings, and acquisitions. A report from Autonomous Research suggested that this activity may have fallen as much as 30% in the first quarter. Last week, Jefferies (JEF) reported a 25% fall in Investment banking and capital market activity.
The volatility comes at a time when banks are spending excessively to combat the rise of financial tech competition and improve cybersecurity protections.
To be clear, not all volatility is bad for banks. Trading activity picks up as clients move cash positions, generating fees for banks. Over the past two years, the five biggest Wall Street banks have generated over $100 billion in collective annual trading revenue.
However, Piper Sandler reported that Average U.S. daily cash-equities volume dropped 12% y/y in the first quarter. This was against a tough back drop as Q1 of 2021 was boosted by the “meme” stock trades.
Fixed Income on the other hand was very active. The expectations for the Fed to increase rates generated a lot of activity in the segment. Goldman Sachs analysts believe there was a fourfold increase in activity. That could bode well for J.P. Morgan (JPM), Bank of America (BAC) and Citigroup (C) which generate more trading revenue from the fixed income side.
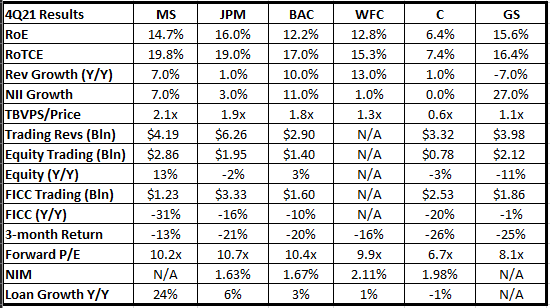
Q4 2021 Performance:
Expectations are low headed into the quarter. JEF is viewed as a precursor for the group. Its March 29 earnings report underwhelmed the market. The stock traded at $33.35 ahead of the earnings. It is down approximately 3% since that report in relatively muted trade.
The SPDR Financial ETF (XLF) suggests investors are concerned about bank performances. The group is down 5% from its March highs. It has slipped below its 50- and 200-daily moving averages ($38.60 convergence area) and is trading below the longer-term trend 50-weekly moving average.
The Relative Strength Index (RSI) is light at 46. A reading of 30 or lower reflects oversold conditions. This suggests that there is some further downside potential despite the weakness heading into these reports. As we can see on the monthly chart below, the $36 level has been a key area of support since March 2021. That is in jeopardy of being breached.
XLF Chart:
[boldgrid_component type=”wp_block” opts=”%7B%22widget-block%5B%5D%5Bcontent%5D%22%3A%22%3C!–%20TradingView%20Widget%20BEGIN%20–%3E%5Cr%5Cn%3Cdiv%20class%3D%5C%22tradingview-widget-container%5C%22%3E%5Cr%5Cn%20%20%3Cdiv%20id%3D%5C%22tradingview_377e0%5C%22%3E%3C%2Fdiv%3E%5Cr%5Cn%20%20%3Cdiv%20class%3D%5C%22tradingview-widget-copyright%5C%22%3E%3Ca%20href%3D%5C%22https%3A%2F%2Fwww.tradingview.com%2Fsymbols%2FAMEX-XLF%2F%5C%22%20rel%3D%5C%22noopener%5C%22%20target%3D%5C%22_blank%5C%22%3E%3Cspan%20class%3D%5C%22blue-text%5C%22%3EXLF%20Chart%3C%2Fspan%3E%3C%2Fa%3E%20by%20TradingView%3C%2Fdiv%3E%5Cr%5Cn%20%20%3Cscript%20type%3D%5C%22text%2Fjavascript%5C%22%20src%3D%5C%22https%3A%2F%2Fs3.tradingview.com%2Ftv.js%5C%22%3E%3C%2Fscript%3E%5Cr%5Cn%20%20%3Cscript%20type%3D%5C%22text%2Fjavascript%5C%22%3E%5Cr%5Cn%20%20new%20TradingView.widget(%5Cr%5Cn%20%20%7B%5Cr%5Cn%20%20%5C%22width%5C%22%3A%20%5C%22100%25%5C%22%2C%5Cr%5Cn%20%20%5C%22height%5C%22%3A%20610%2C%5Cr%5Cn%20%20%5C%22symbol%5C%22%3A%20%5C%22AMEX%3AXLF%5C%22%2C%5Cr%5Cn%20%20%5C%22interval%5C%22%3A%20%5C%22W%5C%22%2C%5Cr%5Cn%20%20%5C%22timezone%5C%22%3A%20%5C%22Etc%2FUTC%5C%22%2C%5Cr%5Cn%20%20%5C%22theme%5C%22%3A%20%5C%22light%5C%22%2C%5Cr%5Cn%20%20%5C%22style%5C%22%3A%20%5C%221%5C%22%2C%5Cr%5Cn%20%20%5C%22locale%5C%22%3A%20%5C%22en%5C%22%2C%5Cr%5Cn%20%20%5C%22toolbar_bg%5C%22%3A%20%5C%22%23f1f3f6%5C%22%2C%5Cr%5Cn%20%20%5C%22enable_publishing%5C%22%3A%20false%2C%5Cr%5Cn%20%20%5C%22allow_symbol_change%5C%22%3A%20true%2C%5Cr%5Cn%20%20%5C%22container_id%5C%22%3A%20%5C%22tradingview_377e0%5C%22%5Cr%5Cn%7D%5Cr%5Cn%20%20)%3B%5Cr%5Cn%20%20%3C%2Fscript%3E%5Cr%5Cn%3C%2Fdiv%3E%5Cr%5Cn%3C!–%20TradingView%20Widget%20END%20–%3E%22%7D”]
Investors have been cautious on the financial institutions heading into this print. Bulls will point to negative news priced into shares and low expectations. We will be provided some insight into investor sentiment as stocks react to the earnings.
Banks’ ability to hold key support levels will be the big story for earnings this week. An inability to find support will drag the group lower and set up weak market conditions as we head deeper into earnings season.
Key Bank Earnings Reports
- P. Morgan (JPM)- Wednesday before the market opens. Stock is trading near 52-week lows. A test of the $125 area would be huge as this holds long-term trend indicators for the 200-weekly MA and the 50-monthly MA.
- Citigroup (C)– Thursday before the market opens. Its international exposure (51% of revenue) raises expectations for volatility. This has been reflected in shares which are trading at the worst levels since November of 2020.
- Goldman Sachs (GS)- Thursday before the market opens. The stock is trading near its 52-week low. It has been fighting to hold the $320-area over the past couple of weeks. Its RSI sits at 37 reflecting the heavy activity in shares.
- Morgan Stanley (MS)- Thursday before the market opens. A very similar chart to MS which makes sense as these are the two ‘pure play’ Investment Banks. MS is fighting to hold the $82 level ahead of this report. Shares are at 10-month lows ahead of the print.
- Wells Fargo (WFC)- Thursday before the market opens. This is the best chart of the group. WFC enjoyed a strong run last year as it should see a boost from the rates as it has a smaller investment banking unit then peers. There is also a valuation aspect as the bank was trading at a lower valuation due to government sanctions.