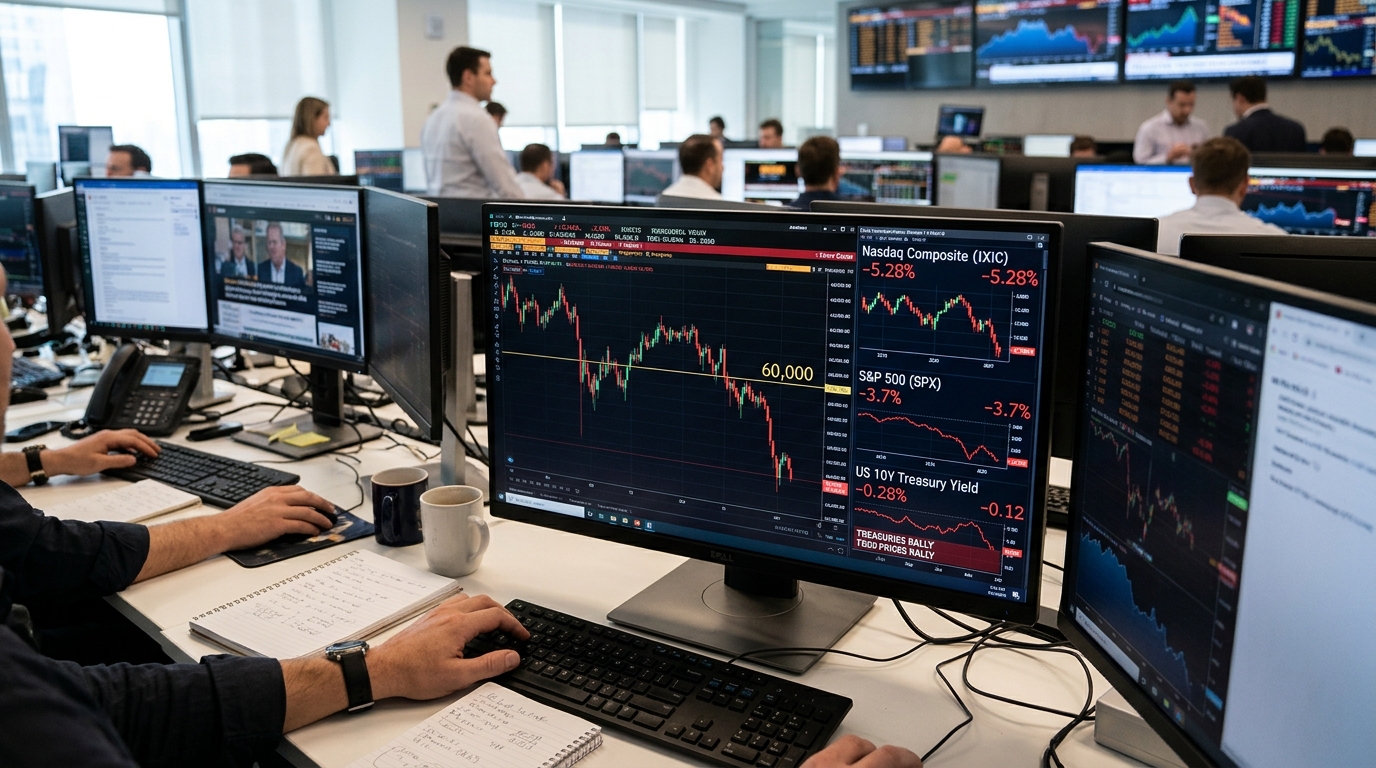
Friday’s close settled an argument that had been building for a week. The S&P 500 sank 3.70%, or 265.44 points, to 6,910.39, its seventh straight loss, entering a correction with a weekly drop of 8.6%, its worst week since April 2025. Both the S&P 500 and Dow moved more than 10% below their closing records. The Nasdaq Composite plummeted 5.28% to 22,617.73. The question now is whether this is a broad market breakdown or concentrated carnage wearing a market-wide label.
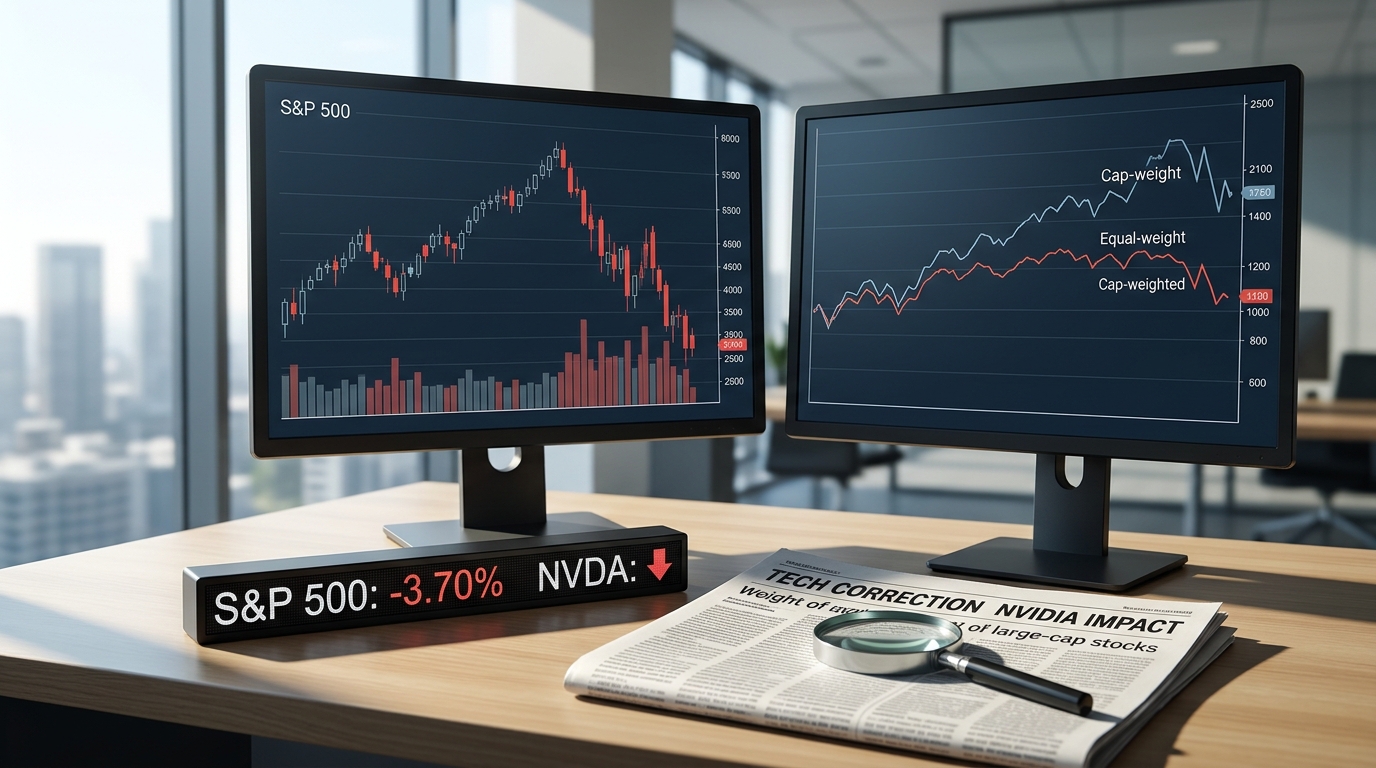
The equal-weight index answers that question directly. The Invesco S&P 500 Equal Weight ETF (RSP) fell 1.98%, roughly half the cap-weighted index’s loss. When the 500 largest U.S. companies each count equally, the damage is real but considerably less severe. That gap is the story. It means megacap tech is absorbing the bulk of the index’s pain, and the rest of the market is not collapsing in sympathy.
Even so, breadth was not clean. Decliners outnumbered advancers 376 to 123 in the S&P 500. The Russell 2000 fell 2.76% to 2,581.79. This is not a correction hiding inside a handful of tickers. But it is unambiguously led by them.
What Is Driving the Giants Lower
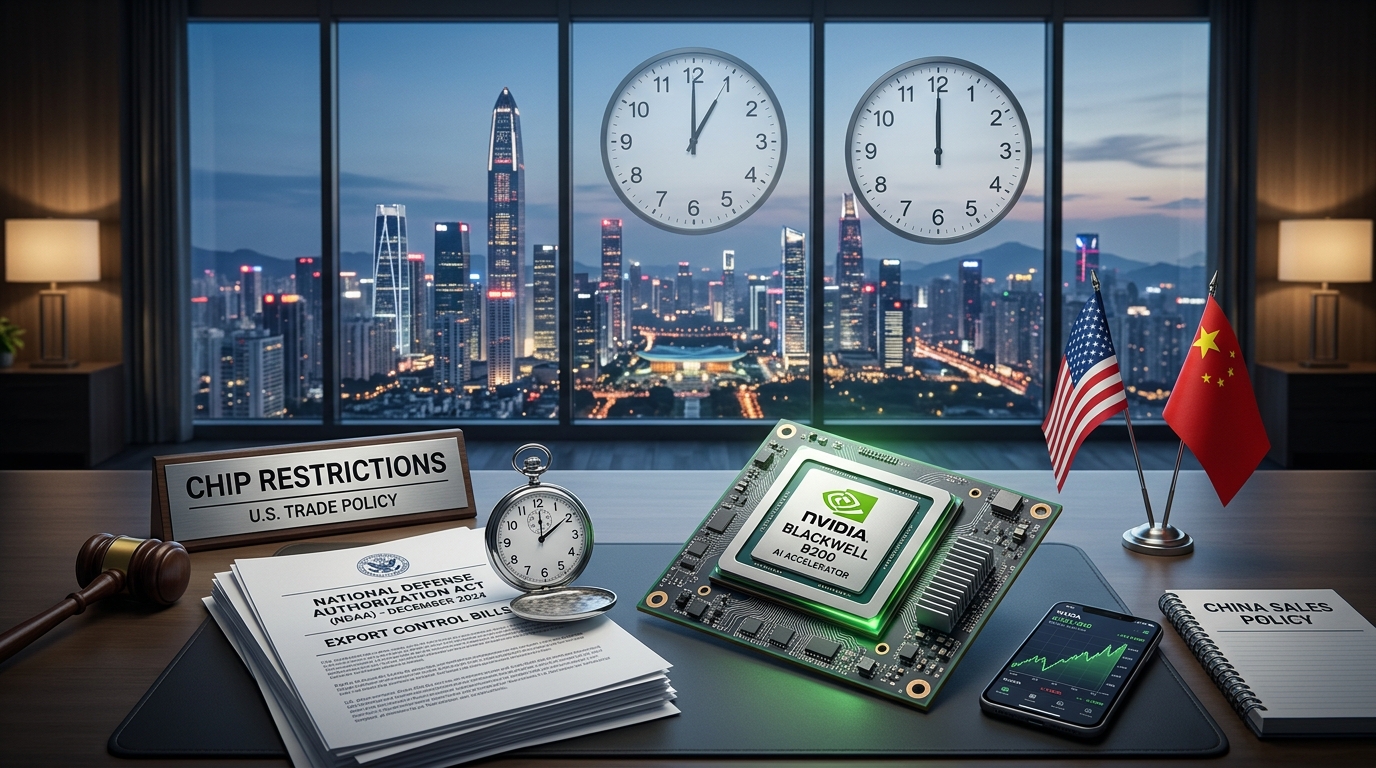
Nvidia sits at the center of it. Shares plunged about 14% on Friday after Reuters reported that the SEC is investigating the company’s accounting practices. The dominant designer of AI chips has shed more than a quarter of its value since Jensen Huang stepped down as CEO on November 11, effective immediately.
The trigger earlier in the week was Anthropic, the Claude chatbot developer whose record-breaking IPO on Thursday had been billed as a pure-play bet on the AI boom. The stock opened at $111.50 and then tumbled about 13% on Friday, its second day of trading. Rather than steadying sentiment around AI, Anthropic’s debut accelerated the unwind.
Broadcom fell 12% after a report that Google had scaled back its plans for Broadcom AI chips. The selling cut through the entire semiconductor supply chain.
What the Market May Be Missing
The 200-day moving average is gone, and it went quickly. The S&P 500 first closed below its 200-day moving average on Tuesday, its first close below that level since April 7. By Friday the index sat at 6,910, roughly 6% under a line that, once broken, often draws in systematic sellers.
The VIX is flashing a sharper warning than the index moves alone suggest. It jumped 26.20% to 35.89, its highest close since late March. Fear at that level tends to suppress risk appetite well past the initial catalyst. Meanwhile, the 10-year yield fell to 4.92% as investors moved into bonds, confirming that Friday’s flight was genuine and not simply tax-loss positioning.
The S&P 500 is still up 0.95% for 2026, just. The Nasdaq is not. The Nasdaq Composite dropped 5.28% to 22,617.73, putting it below where it started 2026. For an index that was up nearly 19% as recently as October 6, that reversal in six weeks is a compression of risk that seldom ends in a single session.
Risks and Counterpoints
The case that this is primarily a megacap problem is real and worth taking seriously. RSP is up about 10% year to date, based on returns through Friday. Small and mid-cap earnings have been solid. About 50% of S&P 500 stocks remain above their 50-day moving average, a level that is higher than the below-40% or even below-20% readings typically seen at durable market bottoms. That is not the picture of a market in full capitulation.
Against that: the Nasdaq Composite suffered its worst weekly percentage decline since March 2020. Regulatory risk around Nvidia is compounding rather than resolving. An SEC probe is not evidence of wrongdoing, and many are closed without going further, but the CEO vacancy and a federal accounting review form a pile that is hard to dismiss with one rally.
What to Watch Next
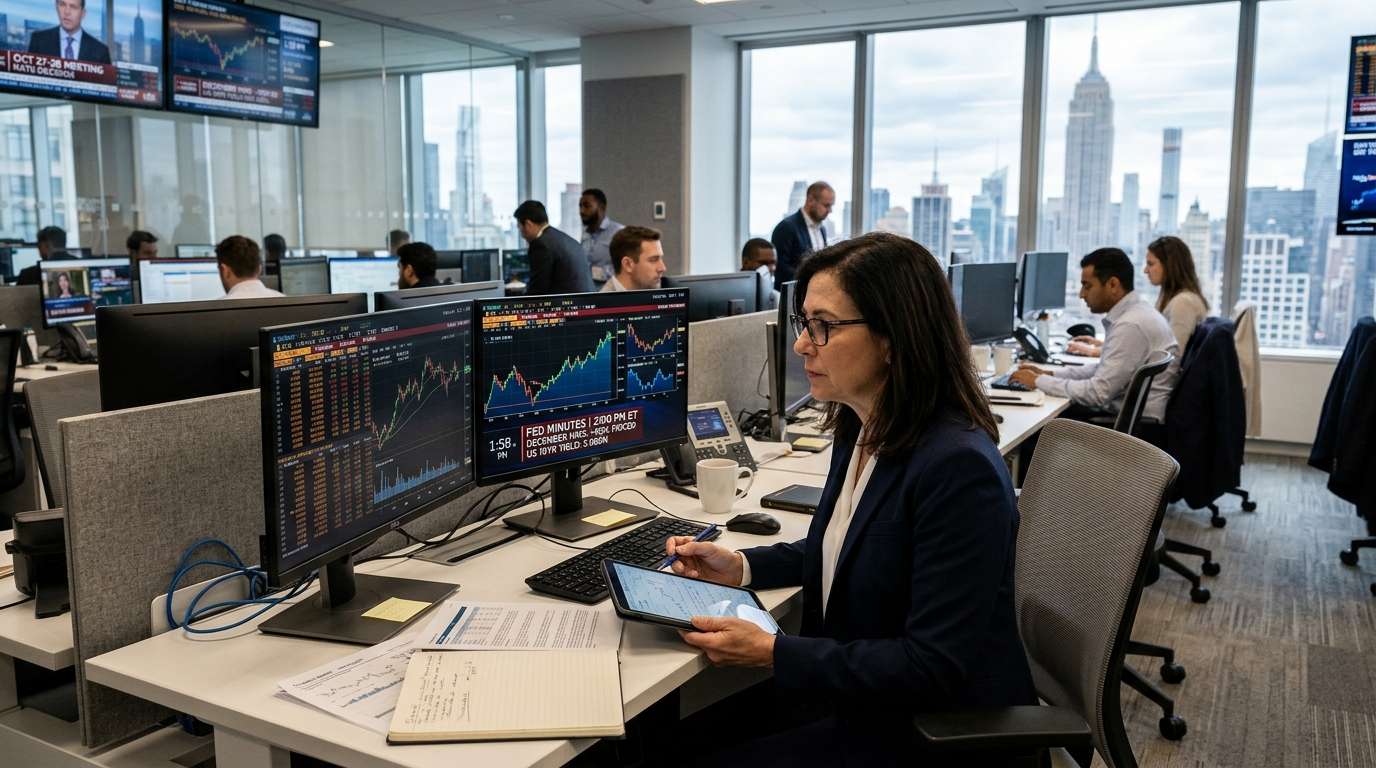
Three things will determine whether 6,910 is a floor or a waypoint. First, the PCE inflation reading due next week: a Federal Reserve losing the inflation fight is one of the forces investors are citing behind this selloff, and a hot number would renew rate-hike bets that are already elevated. Second, any official statement from Nvidia on the SEC probe. Third, watch RSP relative to SPX daily. If that gap narrows because RSP accelerates lower rather than SPX recovering, the correction stops being a megacap story and becomes something broader.
The last time the S&P 500 had a correction was March 2025, as the Trump administration’s trade war rattled the market. That one found its footing. This one has a different cause, a more concentrated source of damage, and a more uncertain regulatory backdrop. Whether those differences matter more than the similarities is what the next two weeks will tell us.