June 18, 2026
We Haven’t Seen This Since 1999
Featured – Murphy USA: The Fuel Retail Overhaul
A note from Stansberry Research
Dear Reader,
The stock market has been on a tear for years…
Tech companies with no earnings are worth more than industrial giants that have built real things for a century.
A single sector – fueled by a transformative new technology – has made a handful of early investors obscenely rich.
It seems like everybody is getting rich. Your neighbor, your barber, the guy on the radio.
“This can’t possibly last,” you tell yourself.
That was 1999.
Now, let me paint you another picture…
The stock market has been on a tear for years.
AI companies with no earnings are worth more than industrial giants that have been around for a century.
A handful of tech stocks – SanDisk, Lumentum, Micron, and Bloom Energy – have surged 986%… 1,256%… even 4,498% – in recent months.
Sound familiar?
That’s because the market is experiencing a once-in-a-generation phenomenon known as a “Melt Up.”
I’ve studied every single major market Melt Up in recorded history: gold in 1980, Japan in 1989, the dot-com bubble in 1999, and bitcoin in 2017, to name a few.
And I’m telling the 344,000 readers who follow my work:
What we’re seeing right now isn’t similar to 1999. It IS 1999. The pattern is identical.
The same irrational exuberance. The same once-skeptical investors now scrambling to get in before they’re left behind.
Here’s what that means for you…
In final innings of the last Melt Up, the Nasdaq nearly doubled in just five months. Certain stocks did even better, like Nvidia, up 513%, NetApp, up 561%, Incyte, up 779%, Strategy, up 1,017%, and Myriad Genetics, which soared 1,076%.
Then, in March 2000, the Melt Down arrived… and it took 15 years for the tech-heavy Nasdaq to recover.
The investors who got rich (and stayed rich) weren’t lucky. They understood the pattern, positioned themselves ahead of the mania, and knew when to get out.
Right now, the early signs of a Melt Up are unmistakable… And as it spreads to the rest of the market, it may be the last chance you have to make years’ or even decades’ worth of market returns in just a few short months.
I lay out everything you need to know to get yourself ready for the Melt Up right here.
Regards,
Brett Eversole
Senior Editor & Analyst, Stansberry Research
P.S. In 1999, if you had known the Melt Up was coming, you could have positioned yourself for game-changing gains… And then avoided the Melt Down that followed.
That’s EXACTLY what I’m showing my readers to do right now.
I’ve identified the specific steps you need to take to ride the Melt Up higher – and the exit strategy to make sure you’re out before the music stops.
Click here to watch my presentation now – before it’s too late.
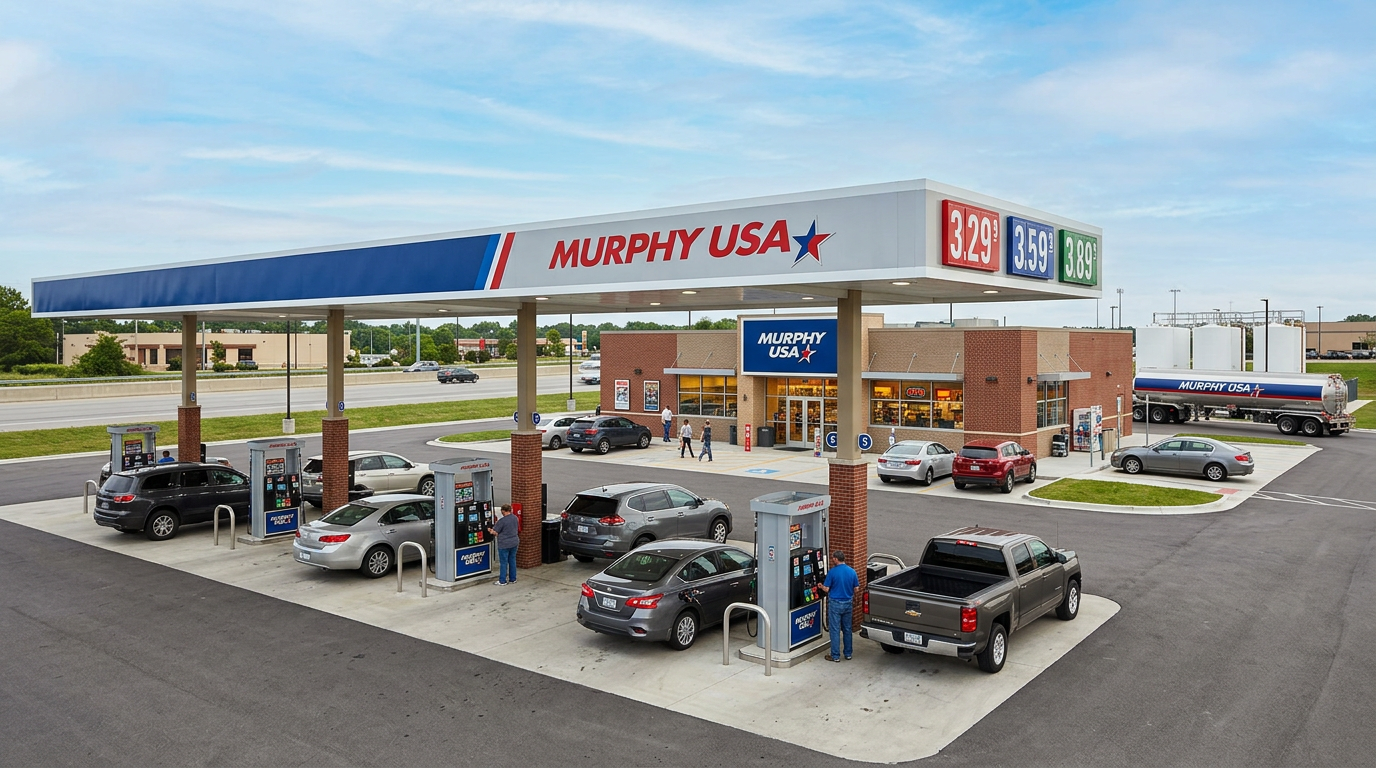
Murphy USA: The Fuel Retail Overhaul
There is a stock sitting on Zacks top value tracking lists this morning with intense early volume, a freshly upgraded Strong Buy rating, and a 26.6% upward revision in its 2026 earnings consensus over just the last 60 days. The trailing P/E is 19.83. The Consumer Discretionary sector average sits at 30.97. That gap does not stay open forever.
That stock is Murphy USA Inc. (MUSA).
What Just Happened
Q1 2026 results came in hard. Murphy USA posted EPS of $7.28 against a consensus estimate of $5.37 — a 35.57% earnings surprise. That compares to just $2.63 per share in the same quarter a year ago. Revenue for the quarter hit $4.82 billion, surpassing estimates by nearly 4%. The company has now beaten consensus EPS estimates in each of the last four quarters.
Following those results, the 2026 full-year consensus estimate climbed from $25.52 per share to $32.32. That is a 26.6% revision in 60 days. The 2027 estimate moved up too, from $27.33 to $29.56. Analysts are not just nudging numbers. They are rethinking the earnings power of this business.
I’ve Rarely Seen This With Silver
This combination – 20% dividends + 68% share appreciation – never happens with silver. But it is now possible thanks to a new ETF that delivers the best of worlds.
What the Business Actually Does
Murphy USA operates over 1,700 gas stations and convenience stores, most of them anchored next to Walmart locations. That real estate strategy is not accidental. It drives consistent foot traffic from price-sensitive shoppers who are already in the parking lot. The company sells fuel at tight margins but high volume, then captures the higher-margin merchandise and nicotine sales inside the store. It is a simple model. It just works.
Slight tangent, but worth noting: Murphy Drive Rewards membership grew 11% in Q1 and QuickChek Rewards was up 30%. That loyalty data matters more than most people give it credit for. Repeat visits are the whole game in convenience retail, and those numbers suggest the traffic base is deepening, not eroding.
The Numbers Worth Watching
- Trailing P/E: 19.83 vs. Consumer Discretionary sector average of 30.97
- Forward P/E: 20.62
- 2026 EPS consensus: $32.32 (revised up from $25.52 over 60 days)
- Q1 2026 EPS: $7.28 vs. $2.63 year-ago (+177% YoY)
- Q1 2026 revenue: $4.82 billion, beat estimates by ~4%
- TTM revenue: $17.3 billion at a price-to-sales of just 0.55x
- EBITDA: $1.14 billion, EBITDA margin 5.26%
- Return on equity (TTM): 80.34%
- New store target: 45 to 55 openings in 2026
- New 2022/2023 store class: outperforming chain average by nearly 20% in fuel gallons and 40% in merchandise margin
That return on equity figure is not a typo. 80.34% is a number you expect from a software company, not a gas station operator. It reflects the capital efficiency of a business that does not need to own expensive real estate to run high-volume locations.
Is It Cheap?
The trailing multiple of 19.83x is already below the Specialty Retail industry average of 20.5x. Against the broader Consumer Discretionary sector at 30.97x, the discount is substantial. And that trailing figure does not yet reflect the full weight of the revised 2026 estimates. On a forward basis, the stock is being priced for a business growing at a slower pace than the one management just reported.
The stock is up 36.2% over the past three months and has returned 44.8% year to date. Some of that earnings revision is already in the price. That is the honest version of this analysis. But the multiple compression argument still holds: a company with 80%+ ROE, four straight beats, and a major upward estimate cycle does not typically stay at 19x for long.
Investors are watching this fast growing tech company.
No, it’s not the publicly traded tech giant you might expect… Meet $MODE, the disruptor turning phones into income generators.
Mode’s 32,481% revenue growth ranked them #1 on Deloitte’s list of fastest-growing companies in software. They aim to pioneer “Privatized Universal Basic Income” powered by technology, not government, and their EarnPhone has already helped consumers earn & save $1B+. Their share price is set to change on 5/29 and the opportunity to invest at their current price is limited.
Share price moves today. Last chance to lock in current pricing.
Please read the offering circular at invest.modemobile.com. This is a paid advertisement for Mode Mobile’s Regulation A Offering.
Bull / Base / Bear
- Bull: Fuel supply margins normalize in H2 2026 as management projected, new store economics continue to outperform, and the multiple expands toward the sector average. $32 EPS at even 23x gets you a very different stock price.
- Base: Earnings come in near the revised $32.32 estimate, merchandise contribution keeps growing at low single digits, and the stock grinds higher with the broader market.
- Bear: Fuel margins compress again, product supply and wholesale economics disappoint a second time, and the recent estimate spike proves too optimistic. The stock gave back ground in late 2025 when that exact scenario played out.
Cheap Investor Scorecard
- Trailing P/E below sector average: YES (19.83 vs. 30.97)
- EPS estimate revision trend: STRONGLY POSITIVE (+26.6% in 60 days)
- Consecutive earnings beats: YES (4 of 4 quarters)
- Loyalty / traffic growth: YES (Drive Rewards +11%, QuickChek +30%)
- New store pipeline active: YES (45 to 55 openings guided for 2026)
- New store outperformance vs. chain: YES (+40% merchandise margin)
- Return on equity above 50%: YES (80.34%)
- Price-to-sales under 1x: YES (0.55x)
- Zacks rank upgrade: YES (Strong Buy, top 5% of covered stocks)
- Balance sheet leverage manageable: WATCH (total leverage ratio 1.96x as of Q1 2025)
Bottom Line
If fuel supply economics hold into the back half of 2026 and the new store class keeps delivering, Murphy USA has a credible path to closing the gap between what it earns and what the market is willing to pay for it. The estimate cycle is fresh, the beat history is real, and the multiple is still far below where a business with these returns typically trades.
If fuel margins roll over again the way they did in early 2025, that $32 EPS number gets trimmed and the story gets messier. That is the risk. Watch the H2 fuel margin data closely before adding size.
The Cheap Investor