July 2, 2026
Silver’s Sixth Deficit
Featured: Silver’s Sixth Deficit
New to Trading Options? Try THIS
An Easy Options Strategy For Beginners:
Get the Strategy + the “Battle-Tested” ticker today – FREE

✓ How the 11-Hour Options Strategy works – explained in plain English, from A to Z…
✓ The three things you need to start trading options today.
✓ Why this single-focused window has so much more potential than grinding through charts all day (and lets you actively trade while still LIVING your life).
✓ See a simple 3-question filter you can use to help protect yourself before ever placing a trade.
✓ And the exact “rinse and repeat” ticker used nearly 900 times with a 95.3% win rate, just to get you started.
Send me my Free Copy of the 11-Hour Options For Beginners Guide – NOW
To your trading success,
Dave Aquino
Base Camp Trading
FEATURED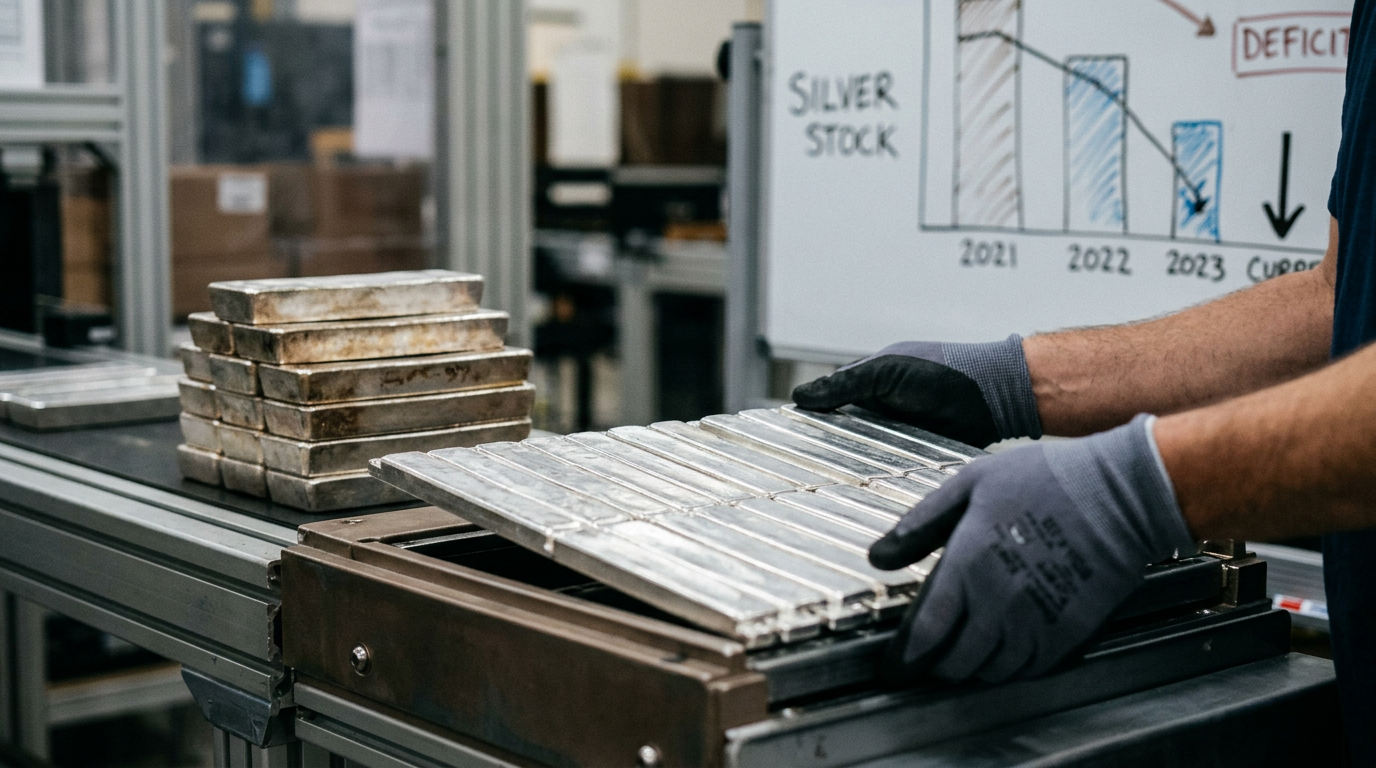
Silver’s Sixth Deficit
The Silver Institute’s World Silver Survey 2026 landed in April. The headline was straightforward: the silver market is heading into its sixth consecutive annual supply deficit, projected at 46.3 million ounces — widening from 40.3 million ounces in 2025. That is a 15% increase in the shortfall, year over year. Both supply and demand are contracting in 2026, but supply is falling faster. When both sides of the ledger shrink and the gap still grows, the physical market is getting tighter, not looser.
Most investors skimmed it and moved on.
What’s interesting is the cumulative math. Since 2021, the silver market has drawn down 762 million troy ounces from above-ground stocks. Not in a single dramatic event. Slowly, steadily, year after year. The World Silver Survey describes it plainly: silver has entered an era of reduced stocks. Tightness will not be constant, but liquidity will generally be thinner, lease rates more volatile, and price moves likely larger than investors have grown used to. That is the Silver Institute’s own language, in its flagship annual publication.
That is not a cyclical number. That is structural depletion.
Did Elon Musk Just Open America’s Last Retirement Window?
Jeff Brown believes by the end of this month, this Elon Musk new AI breakthrough will collide…
With a powerful market prophecy that has correctly predicted some of the biggest market booms going back to 1950…
Giving Americans a rare and perhaps last chance to turn a small stake into an entire six-figure nest egg in the next 12-18 months.
The last time something like this happened, investors had a chance to turn a small stake of $10,000 into as much as $366,000 in just 14 months.
Here is the part most portfolios are not accounting for. Mine supply is essentially inelastic. Approximately 74% of silver is extracted as a byproduct of copper, zinc, and lead operations. Production decisions are made based on base metal economics, not silver prices. Mine production for 2026 is forecast at 844.1 million ounces — essentially flat — despite silver averaging $40.03 per ounce in 2025, a 42% annual increase. In a normal commodity market, a 42% average price gain triggers aggressive mine expansion. It has not happened here, and it will not happen quickly. New primary silver supply takes five to ten years to bring online.
At the same time, the demand picture is shifting in ways worth understanding carefully. Industrial applications — solar panels, electric vehicles, AI data centers, high-speed transmission hardware — still account for the majority of silver consumption, and that category is relatively price-insensitive. What changed in 2025 and into 2026 is that solar manufacturers have been actively reducing silver intensity per panel. Industrial fabrication fell 3% in 2025 to 657.4 million ounces. The gains from AI infrastructure, autos, and power grid spending were not enough to fully offset that thrifting trend. So the industrial demand story is more nuanced than it was two years ago.
What filled the gap was investment demand. Coin and bar demand rose 14% in 2025 and is forecast to jump another 18% in 2026, reaching its highest level since 2022. That growth is being driven largely by the US, where retail demand is expected to rebound 57%. ETP holdings remain elevated. The physical bid is structural, not episodic. Financial buyers are absorbing whatever the industrial pullback leaves behind, and then some.
Slight tangent, but it matters: China implemented strict export controls on refined silver on January 1, 2026. This severed traditional arbitrage routes and created a persistent premium of $8 to $13 per ounce on the Shanghai Gold Exchange compared to New York prices. Metal that used to flow freely between East and West no longer does. That fragmentation of the global market makes the supply picture structurally tighter than the headline deficit figure alone suggests.
This year has not been calm. Silver hit an all-time high of $121.58 on January 29, 2026, before a sharp CME margin-hike-driven correction sent it tumbling. As of early July, prices have pulled back to around $60 per ounce — roughly 50% off the January peak — caught between Fed rate hike expectations, a firmer dollar, and ongoing uncertainty around US-Iran talks. The gold-to-silver ratio now sits around 68:1, well off the 100:1 extreme hit in April 2025, but meaningfully wider than where it was at the January highs.
The violent price action scared off some buyers. That may be exactly the wrong response to what the supply data is actually saying.
The structural case does not require the price to move tomorrow. It requires the deficit to continue — which it has, every year since 2021, without exception. In October 2025, available silver in London vaults fell to a historic low of 17% unencumbered, triggering a physical liquidity squeeze that sent one-month lease rates from roughly 1% to over 30% in a matter of weeks. The underlying conditions that caused that squeeze have not been resolved. The World Silver Survey describes it as the result of above-ground inventory drawdown creating a market with fewer degrees of freedom. That is institutional language for: the buffer is gone.
Silver sits at the intersection of monetary metal demand, energy transition infrastructure, and technology manufacturing. That dual role creates volatility. It also creates a floor that gold, in its purely monetary role, does not share. The deficit widens. The reserves shrink. The market keeps finding reasons to look past it.
At some point, those reasons run out.